Explaining the Broken Housing Politics of San Francisco
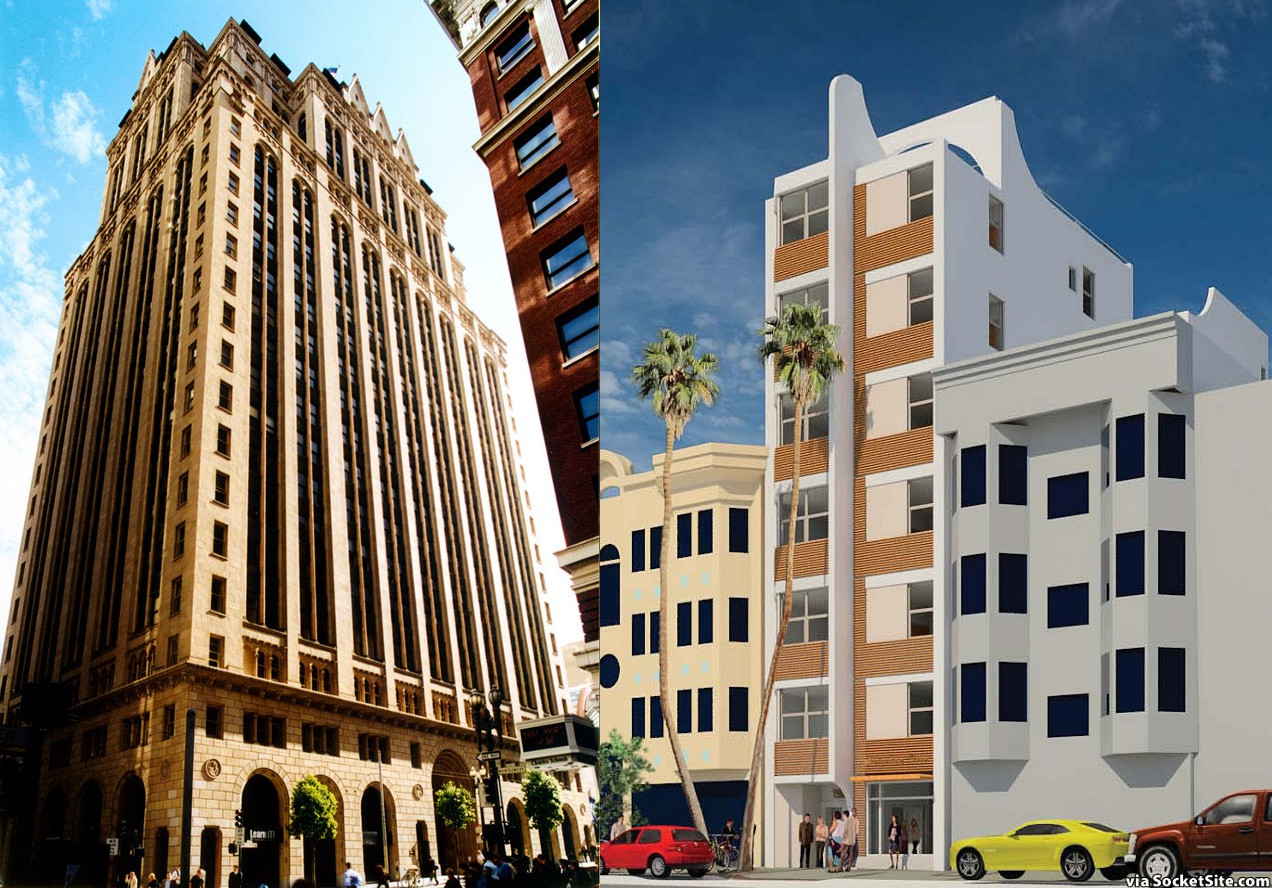
Have you ever wondered why old buildings look like the building on the left, but new buildings look like the one on the right?
It’s because we made the old design illegal, and the new design mandatory.
Why is it like this?
San Francisco has a government structured to empower anti-housing NIMBYs, whose retirement strategy is to inflate their home value by continually blocking housing construction.
Our decision making process is designed to be capricious: no housing permits are guaranteed by law. Everything you might want to do with your home is subject to a public hearing in front of an unelected Planning Commission who have near dictatorial control over what gets built in the city. The only housing rules guaranteed by law are what you can’t do: you can’t build tall, you can’t build dense, you can’t build an apartment building in over 70% of San Francisco.
Even where it is legal to build an apartment building you’re subject to aesthetic mandates including backyard requirements, material variety, facade massing requirements, and window sizes — who can forget the “gentrifying windows” in the Mission? If you request an exemption to any of these mandates, you open up a legal avenue for neighborhood NIMBYs to block your project entirely.
Why don’t we just build more?
It’s illegal.
No, seriously, it’s illegal to build a new apartment building in over 70% of San Francisco:
The red areas are single-unit homes or duplexes. The orange areas allow triplexes or four-plexes. Apartment buildings are only allowed in the green areas.
It didn’t used to be like this. In the 1970s and 1980s we downzoned the city. We decided to make it illegal to build new homes. Those apartment buildings you see out in the Sunset or the Richmond were built before they were illegal. There’s a good chance you’re living in a building that’s illegal to build today.
Now we have a desperate shortage but it’s still illegal to increase supply in the vast majority of the city. And where it is legal to build, we have egregious fees1, mandatory community meetings, and a completely discretionary permitting system. The average time to get your permits approved by our city bureaucracy is nearly four years2. During that time you’re paying the mortgage on the land, lawyers, architects, public relations firms, etc. And don’t forget the opportunity cost of the money locked up in the deal.
At the end of the process you go in front of the unelected central Planning Commission, which is structured to amplify the voices of NIMBYs and neighborhood busybodies who oppose change.
But isn’t San Francisco in a construction boom?
No.
Blame it on availability bias. When people see a couple cranes in the skyline they think we’re seeing an unprecedented housing boom, but the data doesn’t back that up.
From 2001 to 2018, San Francisco only added about 50,000 units.3 From 1993 to 2013, Tokyo added 2 million units4 (or about 102,000 per year). That’s 5 units per 100 people in San Francisco, and about 15 units per 100 people in Tokyo. Of course, I need to note that Tokyo is currently experiencing a slump in construction; between 2013 and 2018 they only added 307,5005 units. This slump coincides withrising prices for new condosand declining sales.
Year after year, Tokyo has been building more new units as a percent of existing units than San Francisco, until the very recent slump. This furthers my point: even in a slump not seen in decades, Tokyo is producing about the same per capita as San Francisco in a “construction boom.”
Tokyo’s population continues to grow while San Francisco’s mostly stagnates. When you have a shortage of homes, someone has to leave in order for someone to arrive. Or, like many of my friends, you end up living in someone’s living room or closet.
San Francisco in 2019 has roughly 900,000 people and about 10,000 people experiencing homelessness6 (and only about 2,000 shelter beds). As of 2018, the nation of Japan has 126 million people, and about 5,000 experiencing homelessness7. If Japan was run like San Francisco, 1.4 million people would be homeless. If San Francisco was run like Japan, only 35 people would be homeless.
The difference is that the Japanese housing crisis in the 1980s resulted in the national government abolishing local control of zoning. This resulted in a massive influx of new construction. While San Francisco only has a measly 400,000 units, Tokyo now has over 850,000 surplus units8 and you can rent a 2 bedroom apartment in a central location for about $1,000 per month9. You can fit over two San Franciscos in Tokyo’s surplus units. The benefits of a housing surplus are obvious. (Read more about the benefits of Japanese zoning).
What can we do about it?
Get involved.
Our politics won’t be solved by arguing on Twitter or Facebook. You won’t solve it with an app.
Politics is an organizational problem, not a technology problem. You can only fix it by showing up, giving your time, or giving money to the right people and organizations.
Donate to campaigns
I’m running for DCCC, which sets the endorsements for Democratic candidates. In a one-party city, the endorsement matters a lot. Donate to my campaign at https://buss2020.org/donate.
Vallie Brown, London Breed, Scott Wiener, David Chiu, Buffy Wicks, and Nancy Skinner are all fighting to fix our broken system and kick out the crooks who put us in this mess.
Join YIMBY
If you aren’t a YIMBY member, join now. Your support funds activists fighting for more housing. We literally cannot do this without you.
Show Up
Subscribe to the YIMBY calendar and follow us on Facebook. Follow and retweet us on Twitter: @yimbyaction, @yimbyneoliberal, and @sbuss. Subscribe to the YIMBY podcast, Infill. Show up to the events we host and the campaign events we participate in.
Thanks to Dana, Morgan, Matt, Keith, and Hoa-long for thoughts, suggestions, and edits.
Written on August 22, 2019 by Steven Buss.
Originally published on Medium
-
https://www.latimes.com/california/story/2019-08-06/high-housing-fees-california ↩︎
-
https://ternercenter.berkeley.edu/blog/measuring-the-housing-permitting-process-in-san-francisco ↩︎
-
SF Housing units units, 1999–2018: http://default.sfplanning.org/publications_reports/2018_Housing_Inventory.pdf ↩︎
-
Tokyo housing units, 1963–2013: https://www.e-stat.go.jp/en/stat-search/files?page=1&layout=datalist&toukei=00200522&tstat=000001063455&cycle=0&tclass1=000001080435&stat_infid=000031375039 ↩︎
-
Tokyo housing units, 2018: https://www.e-stat.go.jp/en/stat-search/files?page=1&layout=datalist&toukei=00200522&tstat=000001127155&cycle=0&tclass1=000001127156&stat_infid=000031821211 ↩︎
-
https://sf.curbed.com/2019/7/8/20686653/san-francisco-sf-homeless-count-number-population-2019 ↩︎
-
https://www.japantimes.co.jp/news/2018/07/14/national/social-issues/number-homeless-japan-falls-15-year-low-5000/#.XUkfCGRlCh8 ↩︎
-
https://jamesjgleeson.wordpress.com/2018/02/19/how-tokyo-built-its-way-to-abundant-housing/ ↩︎
-
https://www.wsj.com/articles/what-housing-crisis-in-japan-home-prices-stay-flat-11554210002 ↩︎